The Google Chrome browser includes some fantastic monitoring and diagnostics tools via the “chrome://net-internals” URL.
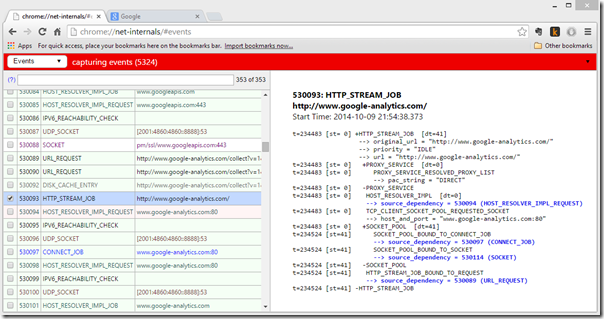
One can view HTTP events much like Fiddler.
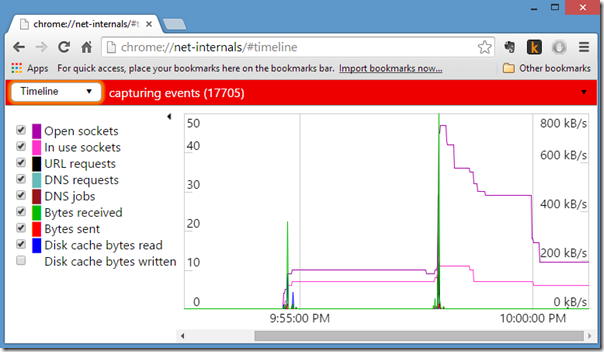
And the #timeline will show Chrome’s low-level usage over time:
Other options include Proxy, Waterfall, DNS, Sockets, SPDY, QUIC, Cache, Modules, and Bandwidth.

